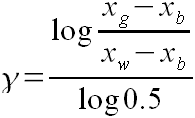
位图调节色阶时,在内部使用的是曲线校正中的伽玛校正。
伽玛校正为调整亮度的方法,它只有一个参数即γ(Gamma)。伽玛校正的变换公式为:

x'为变换后的亮度。xmax为x的最大值。
| γ = 1 | x' = x (没有变化) |
| γ = 0.5 | x' = x2(变暗) |
| γ = 2 | x' = √x(变亮) |
调整色阶的三个滑条的意思
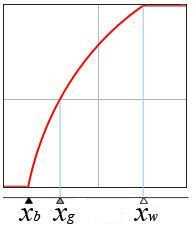
Plotoshop的调整色阶里有黑,灰,白三个滑条,黑为阴影,白为高亮。从0到黑均为黑色;从白到255均为白色;从黑到白为以灰为中值的伽玛校正。(xb为黑,xg为灰,xw为白)
Actionscript 3.0的实现
实现曲线、伽玛校正等可以使用BitmapData.paletteMap。
三个滑条的值分别为xb、xg、xw (0≤xb≤xg≤xw≤255)。Xmax = xb - xw。当x = xg - xb时,因为想x' / xmax = 0.5,所以

var gamma:Number = Math.log((xg - xb) / (xw - xb)) / Math.log(0.5);
var mapR:Array = [], mapG:Array = [], mapB:Array = [];
for(var i:int = 0; i < 256; i++) {
 mapB[i] = i < xb ? 0 : i > xw ? 0xff : 255 * Math.pow((i - xb) / (xw - xb), 1 / gamma);
 mapG[i] = mapB[i] << 8;
 mapR[i] = mapB[i] << 16;
}
image.paletteMap(bmdOrigin, bmd.rect, new Point(), mapR, mapG, mapB);
完整的实现代码:
package bitmap {
 import flash.display.*;
 import flash.filters.*;
 import flash.geom.*;
 import flash.events.Event;

 [SWF(width="256", height="410")]
 public class Histogram3 extends Sprite {
  [Embed(source="023.jpg")]
  private var SampleImage:Class;

  private var dragging:Sprite;
  private var h2pos:Number = 0.5;
  private var h1:Sprite;
  private var h2:Sprite;
  private var h3:Sprite;

  public function Histogram3() {
   stage.scaleMode = "noScale";

   var bmd:BitmapData = Bitmap(addChild(new SampleImage())).bitmapData;

   var s:Sprite = new Sprite();
   addChild(s).y = bmd.height + 10;
   createHistogram(bmd, s);

   s = new Sprite();
   addChild(s).y = bmd.height + 140;
   createHistogram(bmd, s);

   addChild(createSlider()).y = bmd.height + 115;

   var bmdOrigin:BitmapData = bmd.clone();
   addEventListener(
    Event.ENTER_FRAME,
    function(e:*):void {
     if(dragging) {
      var gamma:Number = Math.log((h2.x - h1.x) / (h3.x - h1.x)) / Math.log(0.5);
      var mapR:Array = [], mapG:Array = [], mapB:Array = [];
      for(var i:int = 0; i < 0x100; i++) {
       mapB[i] = i < h1.x ? 0 : i > h3.x ? 0xff : 255 * Math.pow((i - h1.x) / (h3.x - h1.x), 1 / gamma);
       mapG[i] = mapB[i] << 8;
       mapR[i] = mapB[i] << 16;
      }
      bmd.paletteMap(bmdOrigin, bmd.rect, new Point(), mapR, mapG, mapB);

      s.graphics.clear();
      createHistogram(bmd, s);
     }
    }
   );
  }

  // 生成色阶
  private function createHistogram(bmd:BitmapData, s:Sprite):void {
   // 灰度化
   var cmf:ColorMatrixFilter = new ColorMatrixFilter(
    [1 / 3, 1 / 3, 1 / 3, 0, 0,
     1 / 3, 1 / 3, 1 / 3, 0, 0,
     1 / 3, 1 / 3, 1 / 3, 0, 0]
   );
   var bmd2:BitmapData = bmd.clone();
   bmd2.applyFilter(bmd2, bmd2.rect, new Point(), cmf);

   // 用threshold来得到颜色分布
   var values:Array = [];
   for(var i:int = 0; i < 0x100; i++) {
    values[i] = bmd2.threshold(bmd2, bmd2.rect, new Point(), "==",
     i + (i << 8) + (i << 16), 0, 0xffffff, false);
   }
   bmd2.dispose();

   // 画色阶
   var max:int = bmd.width * bmd.height / 50;
   s.graphics.lineStyle(1);
   for(i = 0; i < 0x100; i++) {
    s.graphics.moveTo(i, 100);
    s.graphics.lineTo(i, Math.max(0, 100 - values[i] / max * 100));
   }
  }

  // 生成滑条
  private function createSlider():Sprite {
   // 画滑条可移动的范围
   var slider:Sprite = new Sprite();
   slider.graphics.beginFill(0xffffff);
   slider.graphics.drawRect(0, 0, 256, 10);
   slider.graphics.endFill();
   slider.graphics.lineStyle(1, 0);
   slider.graphics.lineTo(255, 0);
   slider.buttonMode = true;
   slider.useHandCursor = true;

   // 画滑条
   h1 = Sprite(slider.addChild(createButton(0x000000))); h1.x = 0;
   h2 = Sprite(slider.addChild(createButton(0x999999))); h2.x = 128;
   h3 = Sprite(slider.addChild(createButton(0xffffff))); h3.x = 255;

   // mouseDown
   slider.addEventListener("mouseDown", function(e:*):void {
    var localX:Number = slider.globalToLocal(new Point(mouseX, mouseY)).x;

    // 滑动滑条
    var d1:Number = Math.abs(localX - h1.x);
    var d2:Number = Math.abs(localX - h2.x);
    var d3:Number = Math.abs(localX - h3.x);
    var max:Number = Math.min(d1, d2, d3);
    dragging = (max == d1 ? h1 : max == d2 ? h2 : h3);

    // 验证滑条是否超出范围
    var bounds:Rectangle = getDraggableBounds(dragging);
    dragging.x = Math.max(Math.min(localX, bounds.right), bounds.x);
    updateH2(null);

    dragging.startDrag(false, bounds);
   });

   // mouseMove
   stage.addEventListener("mouseMove", updateH2);

   // mouseUp
   stage.addEventListener("mouseUp", function(e:*):void {
    if(dragging) {
     dragging.stopDrag();
     dragging = null;
    }
   });

   return slider;
  }

  // 生成滑条
  private function createButton(color:int):Sprite {
   var s:Sprite = new Sprite();
   s.graphics.lineStyle(1, 0);
   s.graphics.beginFill(color);
   s.graphics.lineTo(5, 8.6);
   s.graphics.lineTo(-5, 8.6);
   s.graphics.endFill();
   return s;
  }

  // 计算滑条的移动范围
  private function getDraggableBounds(s:Sprite):Rectangle {
   if(s == h1) return new Rectangle(0, 0, h3.x - 4, 0);
   if(s == h2) return new Rectangle(h1.x + 2, 0, h3.x - h1.x - 4, 0);
   if(s == h3) return new Rectangle(h1.x + 4, 0, 255 - h1.x - 4, 0);
   return null;
  }

  // 计算灰滑条的移动
  private function updateH2(e:*):void {
   if(dragging && dragging != h2) {
    h2.x = (h3.x - h1.x) * h2pos + h1.x;
    h2.x = Math.max(Math.min(h2.x, h3.x - 2), h1.x + 2);
   }
   else if(dragging == h2){
    h2pos = (h2.x - h1.x) / (h3.x - h1.x);
   }
  }
 }
}
最终效果下载:Histogram2.swf

![[Google]](http://www.google.com/logos/Logo_25wht.gif)
![[Synchronous Space]](http://weihe924stephen.googlepages.com/syncspace-banner.jpg)
![[Creative Commons License]](http://i.creativecommons.org/l/by-nc-sa/3.0/88x31.png)
![[Add to Google]](http://buttons.googlesyndication.com/fusion/add.gif)
![[Aggregated by MXNA]](http://weblogs.macromedia.com/mxna/images/mxna88x31.gif)
![[Flex.org]](http://www.flex.org/images/flexorg.gif)
![Validate my Atom 1.0 feed [Valid Atom 1.0]](http://validator.w3.org/feed/images/valid-atom.png)
![Validate my RSS feed [Valid RSS]](http://resource.googlecode.com/files/valid-rss.png)
![[Powered By Blogger]](http://www.blogger.com/buttons/blogger-powerby-blue.gif)
![[I heart FeedBurner]](http://www.feedburner.com/fb/images/pub/i_heart_fb.gif)
没有评论:
发表评论